
TO ACCESS: Click on "Stats" in the main menu
The Stats Dashboard is there so you can monitor your results. The idea here is to give you the confidence that you are getting the exposure you are looking for, so you can stop wasting your time and money with marketing you can’t track (like print ads!)
All this said, if you don’t know what to look out for on your Stats Dashboard, it is useless! So, here’s a rundown of the info you can find on your Stats Dashboard.
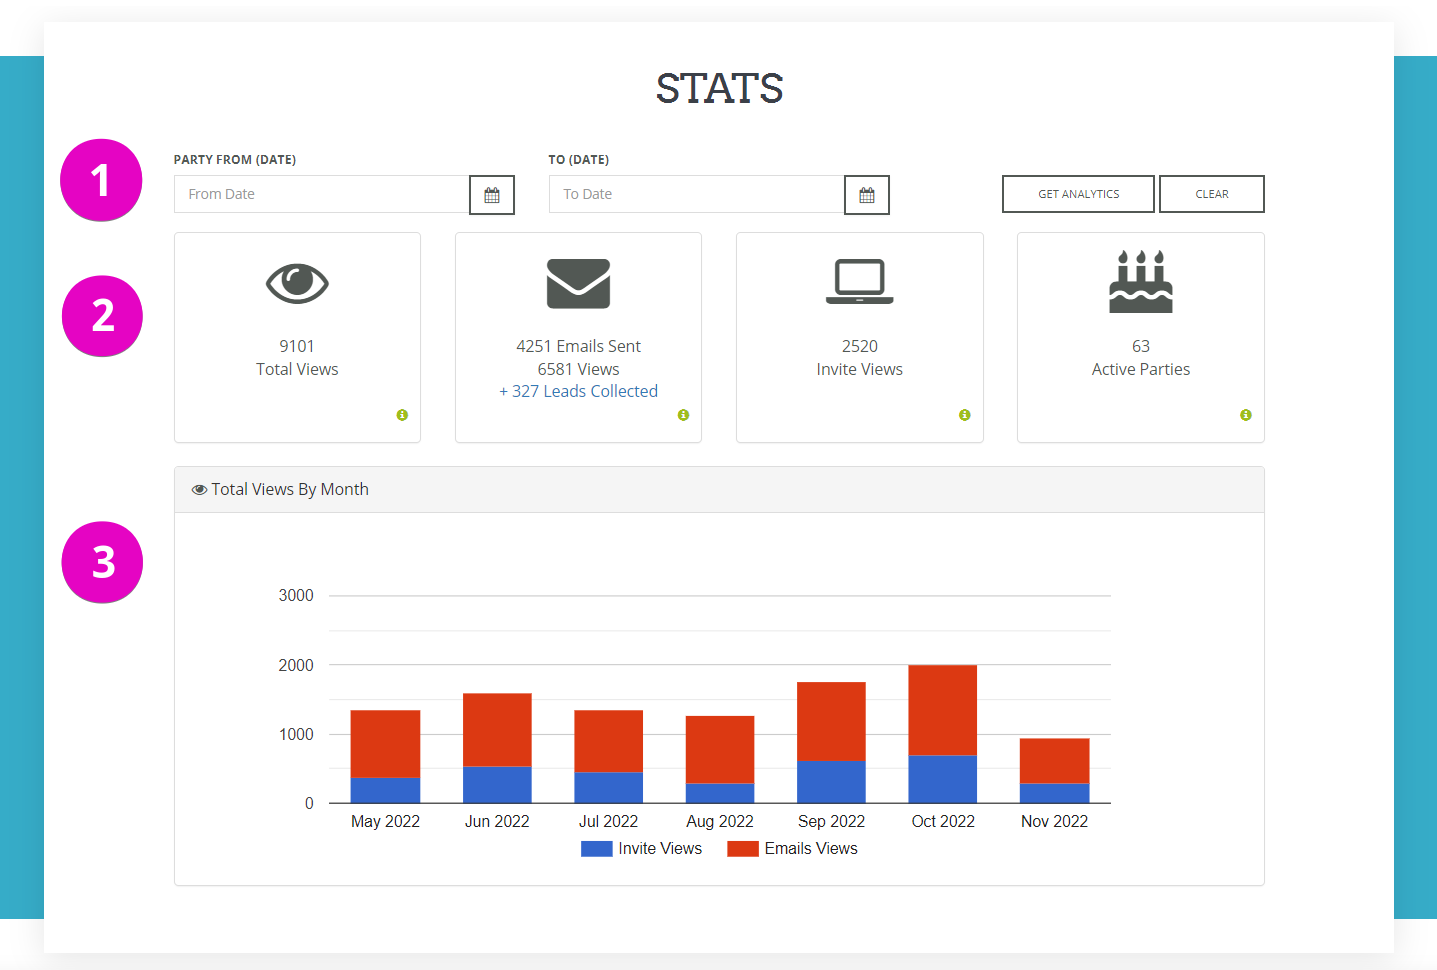
SECTION #1 (see image above)
Here you can change the date range for the stats you are reporting on. Want to see how you performed in a specific month? No problem, set the start and end date for that month only. Want to analyze your first quarter of the year? Piece of cake, set the dates! Curious to see how much exposure you’ve received this year? You guessed, easy as pie, just set those dates and click “Get Analytics”.
SECTION #2 (see image above)
There are a few key metrics reported on in this section. Going from left to right, they are:
- Total Views:
Total number of branded views from emails and invitation pages - Emails:
Total emails sent / Total email views / Total leads collected - Invite Views:
Total number of times your branded invitation pages have been viewed - Active Parties:
Total number of parties with actives guests or parties taking place in the future
SECTION #3 (see image above)
This chart will map out for you how many views you've had over the last several months; split between invitation views and emails views.
---
You can find additional helpful stats on how many times each individual invitation design has been used on the Manage Invitations page.
Well that just about covers it!